Thursday, November 17, 2022


Product NameMonoammonium phosphate
HS Code
31054000
Molecular Weight115.03 g/mol
Chemical FormulaH6NO4P
Synonyms
  • Ammonium dihydrogen phosphate
  • 7722-76-1
  • Ammonium biphosphate
  • Phosphoric acid, monoammonium salt
Region/Countries for which Data is available
  • Asia Pacific: China, India, Indonesia, Pakistan, Bangladesh, Japan, Philippines, Vietnam, Iran, Thailand, South Korea, Iraq, Saudi Arabia, Malaysia, Nepal, Taiwan, Sri Lanka, UAE, Israel, Hongkong, Singapore, Oman, Kuwait, Qatar, Australia, and New Zealand
  • Europe: Germany, France, United Kingdom, Italy, Spain, Russia, Turkey, Netherlands, Poland, Sweden, Belgium, Austria, Ireland Switzerland, Norway, Denmark, Romania, Finland, Czech Republic, Portugal and Greece,
  • North America: United States and Canada
  • Latin America: Brazil, Mexico, Argentina, Columbia, Chile, Ecuador, and Peru
  • Africa: South Africa, Nigeria, Egypt, Algeria, Morocco
CurrencyUS$ (Data can also be provided in local currency)
Supplier Database AvailabilityYes
Customization ScopeOur services can be customized as per the requirements of the customer
Post-Sale Analyst Support360-degree analyst support after service delivery


Request for Real Time Monoammonium phosphate Prices: https://www.procurementresource.com/resource-center/monoammonium-phosphate-map-price-trends/pricerequest

Water is an ideal solvent for mono ammonium phosphate. When mono ammonium phosphate is evaporated from water in the tetragonal system, it forms elongated prisms or needles. Although, it is practically insoluble in ethanol. At temperatures as high as 200 °C, mono ammonium phosphate can remain solid.

In batch or continuous reactors, phosphoric acid and anhydrous ammonia are mixed to yield mono ammonium phosphate. Due to the extremely low partial pressure of ammonia over it, conventional crystallizers are utilised to further crystallise this acidic solution.

Brazil, Russian Federation, Belarus, Poland, and Serbia are the leading mono ammonium phosphate (MAP) producing countries.

Key Details About the Monoammonium Phosphate (MAP) Price Trend:

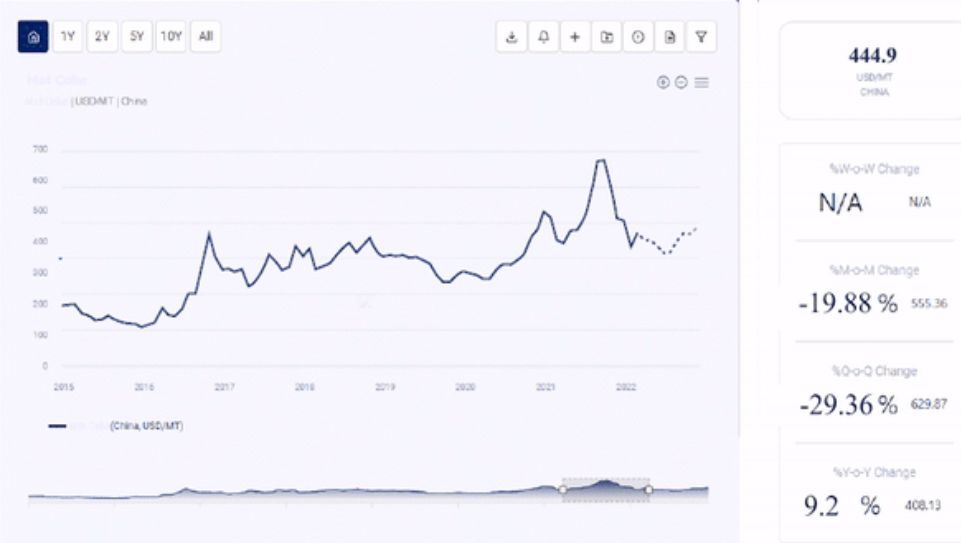
Procurement Resource does an in-depth analysis of the price trend to bring forth the monthly, quarterly, half-yearly, and yearly information on the Monoammonium Phosphate (MAP) price in its latest pricing dashboard. The detailed assessment deeply explores the facts about the product, price change over the weeks, months, and years, key players, industrial uses, and drivers propelling the market and price trends.

Each price record is linked to an easy-to-use graphing device dated back to 2014, which offers a series of functionalities; customization of price currencies and units and downloading of price information as excel files that can be used offline.

The Monoammonium Phosphate (MAP) Price chart, pricing database, and analysis can prove valuable for procurement managers, directors, and decision-makers to build up their strongly backed-up strategic insights to attain progress and profitability in the business.

Industrial Uses Impacting Monoammonium Phosphate (MAP) Price Trend:

Price-Trend-Image

The industrial uses of Mono Ammonium phosphate (MAP) Price Trend, which include agricultural products that are used in wastewater treatment facilities (non-pesticide use), building and construction supplies, wood-based products, electrical goods, chemical for putting out fires, garden and lawn care products, and paper-based goods. Such critical usages of the product have an impact on its price trend.

Key Market Players:

  • Eurochem Group
  • Agrium Inc.
  • Yara International ASA
  • CF Industries Holdings Inc.
  • Coromandel International Ltd.
  • The Mosaic Co.
  • Shifang Changfeng Chemical Co. Ltd

 News and Events:

  •  June 30, 2022: India bought about 3.5 lakh tonnes (It) of di-ammonium phosphate (DAP) fertilizers amid Western sanctions against Russia following its invasion of Ukraine. Russia thus becomes India's top supplier.

Related Reports:

About Us:

 Procurement Resource offers in-depth research on product pricing and market insights for more than 500 chemicals, commodities, and utilities updated daily, weekly, monthly, and annually. It is a cost-effective, one-stop solution for all your market research requirements, irrespective of which part of the value chain you represent.  We have a team of highly experienced analysts who perform comprehensive research to deliver our clients the newest and most up-to-date market reports, cost models, price analysis, benchmarking, and category insights, which help in streamlining the procurement process for our clientele. Our team track the prices and production costs of a wide variety of goods and commodities, hence, providing you with the latest and consistent data.

To get real-time facts and insights to help our customers, we work with a varied range of procurement teams across industries. At Procurement Resource, we support our clients, with up-to-date and pioneering practices in the industry, to understand procurement methods, supply chain, and industry trends, so that they can build strategies to achieve maximum growth.

Contact Us:

Company Name: Procurement Resource
Contact Person: Chris Byrd
Email: sales@procurementresource.com
Toll Free Number: USA & Canada - Phone no: +1 307 363 1045 | UK - Phone no: +44 7537 132103 | Asia-Pacific (APAC) - Phone no: +91 1203185500
Address: 30 North Gould Street, Sheridan, WY 82801, USA

Product NameMild Steel Plate
SynonymsM.S. plates, Low carbon steel plates
Region/Countries for which Data is available
  • Asia Pacific: China, India, Indonesia, Pakistan, Bangladesh, Japan, Philippines, Vietnam, Iran, Thailand, South Korea, Iraq, Saudi Arabia, Malaysia, Nepal, Taiwan, Sri Lanka, UAE, Israel, Hongkong, Singapore, Oman, Kuwait, Qatar, Australia, and New Zealand
  • Europe: Germany, France, United Kingdom, Italy, Spain, Russia, Turkey, Netherlands, Poland, Sweden, Belgium, Austria, Ireland Switzerland, Norway, Denmark, Romania, Finland, Czech Republic, Portugal and Greece,
  • North America: United States and Canada
  • Latin America: Brazil, Mexico, Argentina, Columbia, Chile, Ecuador, and Peru
  • Africa: South Africa, Nigeria, Egypt, Algeria, Morocco
CurrencyUS$ (Data can also be provided in local currency)
Supplier Database AvailabilityYes
Customization ScopeOur services can be customized as per the requirements of the customer
Post-Sale Analyst Support360-degree analyst support after service delivery


Request for Real Time Mild Steel Plate Prices: https://www.procurementresource.com/resource-center/mild-steel-plate-price-trends/pricerequest

A mild steel plate is a kind of carbon steel that contains a small amount of carbon. Low carbon steel is the term given to mild steel because it has between 0.05% and 0.25% carbon by weight, while high carbon steel has between 0.30% and 2.0% carbon.

In contrast to alloy steel, mild steel plate contains fewer alloying elements than iron. Due to the low carbon content, it is more ductile, weldable, and machinable than carbon and other steels. From table frames to cargo ships, mild steel plate is a versatile metal that is used in a variety of goods.

China, Japan, India, Russia, the United States, and Korea are the main producers of mild steel plates.

Key Details About the Mild Steel Plate Price Trend:

Procurement Resource does an in-depth analysis of the price trend to bring forth the monthly, quarterly, half-yearly, and yearly information on the mild steel plate price trend in its latest pricing dashboard. The detailed assessment deeply explores the facts about the product, price change over the weeks, months, and years, key players, industrial uses, and drivers propelling the market and price trends.

Each price record is linked to an easy-to-use graphing device dated back to 2014, which offers a series of functionalities; customization of price currencies and units and downloading of price information as excel files that can be used offline.

The Mild steel plate Price chart, pricing database, and analysis can prove valuable for procurement managers, directors, and decision-makers to build up their strongly backed-up strategic insights to attain progress and profitability in the business.

Industrial Uses Impacting Mild steel plate Price Trend:

Price-Trend-ImageThe price trend for mild steel plate is influenced by its industrial applications, which include those in the automobile, building, energy generating, beverage, and paper industries. Additionally, it is used in furniture, fencing, and structural steel.

Key Market Players:

• POSCO
• Hico Multifin Products Private Limited
• Gravita India Ltd
• Canada Metal North America Ltd
• Jamestown North America
• Boliden Group

News and Events:

• February 2021: Tata Steel resumed the expansion of the cold-roll mill and pellet plant complex at Tata Steel Kalinganagar which was stopped because of the lockdowns. The Kalinganagar factory expansion from 3 million metric tons annually (mtpa) to 8 mpta, is estimated to cost about INR 25,000 crore.

Related Reports:

About Us:

Procurement Resource offers in-depth research on product pricing and market insights for more than 500 chemicals, commodities, and utilities updated daily, weekly, monthly, and annually. It is a cost-effective, one-stop solution for all your market research requirements, irrespective of which part of the value chain you represent. We have a team of highly experienced analysts who perform comprehensive research to deliver our clients the newest and most up-to-date market reports, cost models, price analysis, benchmarking, and category insights, which help in streamlining the procurement process for our clientele. Our team track the prices and production costs of a wide variety of goods and commodities, hence, providing you with the latest and consistent data.

To get real-time facts and insights to help our customers, we work with a varied range of procurement teams across industries. At Procurement Resource, we support our clients, with up-to-date and pioneering practices in the industry, to understand procurement methods, supply chain, and industry trends, so that they can build strategies to achieve maximum growth.

Contact Us:

Company Name: Procurement Resource
Contact Person: Chris Byrd
Email: sales@procurementresource.com
Toll Free Number: USA & Canada - Phone no: +1 307 363 1045 | UK - Phone no: +44 7537 132103 | Asia-Pacific (APAC) - Phone no: +91 1203185500
Address: 30 North Gould Street, Sheridan, WY 82801, USA


Product NameCarrageenan
HS Code13023290
Molecular Weight551.83 g/mol
Chemical FormulaC23H23FN4O7Zn
SynonymsCondrus crispus, Irish Moss.
Region/Countries for which Data is available
  • Asia Pacific: China, India, Indonesia, Pakistan, Bangladesh, Japan, Philippines, Vietnam, Iran, Thailand, South Korea, Iraq, Saudi Arabia, Malaysia, Nepal, Taiwan, Sri Lanka, UAE, Israel, Hongkong, Singapore, Oman, Kuwait, Qatar, Australia, and New Zealand
  • Europe: Germany, France, United Kingdom, Italy, Spain, Russia, Turkey, Netherlands, Poland, Sweden, Belgium, Austria, Ireland Switzerland, Norway, Denmark, Romania, Finland, Czech Republic, Portugal and Greece,
  • North America: United States and Canada
  • Latin America: Brazil, Mexico, Argentina, Columbia, Chile, Ecuador, and Peru
  • Africa: South Africa, Nigeria, Egypt, Algeria, Morocco
CurrencyUS$ (Data can also be provided in local currency)
Supplier Database AvailabilityYes
Customization ScopeOur services can be customized as per the requirements of the customer
Post-Sale Analyst Support360-degree analyst support after service delivery

Request for Real Time Carrageenan Prices: https://www.procurementresource.com/resource-center/carrageenan-price-trends/pricerequest

Carrageenan, a type of naturally occurring sulfated polysaccharide, is a very flexible polymer that takes the form of curling helical forms. Carrageenan is made from an Irish moss-like red seaweed. This edible seaweed, which is endemic to the British Isles, has long been used in cooking and is commonly employed in the food industry as a thickening and gelling agent.

To manufacture carrageenan, an extraction technique is used. The seaweed is harvested, dried, and then given to the manufacturer in the industry. Before being ground into a powder and filtered to remove impurities like sand and dirt, the seaweed is thoroughly cleaned. This intermediate product is treated with a hot alkali solution and the cellulose is then removed by filtration.

The top suppliers of carrageenan are Germany, India, France, Denmark, Netherlands, Singapore, and Spain. Whereas, the leading carrageenan-producing countries are Indonesia, Vietnam, Malaysia, and the Philippines.

Key Details About the Carrageenan Price Trend:

Procurement Resource does an in-depth analysis of the price trend to bring forth the monthly, quarterly, half-yearly, and yearly information on the Carrageenan price in its latest pricing dashboard. The detailed assessment deeply explores the facts about the product, price change over the weeks, months, and years, key players, industrial uses, and drivers propelling the market and price trends.

Each price record is linked to an easy-to-use graphing device dated back to 2014, which offers a series of functionalities; customization of price currencies and units and downloading of price information as excel files that can be used offline.

The Carrageenan price chart, pricing database, and analysis can prove valuable for procurement managers, directors, and decision-makers to build up their strongly backed-up strategic insights to attain progress and profitability in the business.

Industrial Uses Impacting Carrageenan Price Trend:

Price-Trend-Image

Carrageenan Price Trend is used in a variety of industrial production processes that affect the price trend including its usages as an additive in the industries like food, medicines, and pharmaceuticals. Carrageenan also finds its application in gels and thickeners.

Key Players:

• MCPI Corp (Philippines)
• Marcel Carrageenan (Philippines)
• PT Fortuna Cahaya Cemerlang (Indonesia)
• Ina Food Industry Co. Ltd (Japan)
• Caldic BV (Netherlands)

News and Events:

• June 2021: For the bioactive ingredients in the carrageenan-based delivery systems, which help in the permanence and bioavailability of bioactive compounds.

Related Reports:

About Us:

Procurement Resource offers in-depth research on product pricing and market insights for more than 500 chemicals, commodities, and utilities updated daily, weekly, monthly, and annually. It is a cost-effective, one-stop solution for all your market research requirements, irrespective of which part of the value chain you represent.

We have a team of highly experienced analysts who perform comprehensive research to deliver our clients the newest and most up-to-date market reports, cost models, price analysis, benchmarking, and category insights, which help in streamlining the procurement process for our clientele. Our team track the prices and production costs of a wide variety of goods and commodities, hence, providing you with the latest and consistent data.

To get real-time facts and insights to help our customers, we work with a varied range of procurement teams across industries. At Procurement Resource, we support our clients, with up-to-date and pioneering practices in the industry, to understand procurement methods, supply chain, and industry trends, so that they can build strategies to achieve maximum growth.

Contact Us:

Company Name: Procurement Resource
Contact Person: Jolie Alexa
Email: sales@procurementresource.com
Toll Free Number: USA & Canada - Phone no: +1 307 363 1045 | UK - Phone no: +44 7537 132103 | Asia-Pacific (APAC) - Phone no: +91 1203185500
Address: 30 North Gould Street, Sheridan, WY 82801, USA


Product NameColorants
Region/Countries for which Data is available
  • Asia Pacific: China, India, Indonesia, Pakistan, Bangladesh, Japan, Philippines, Vietnam, Iran, Thailand, South Korea, Iraq, Saudi Arabia, Malaysia, Nepal, Taiwan, Sri Lanka, UAE, Israel, Hongkong, Singapore, Oman, Kuwait, Qatar, Australia, and New Zealand
  • Europe: Germany, France, United Kingdom, Italy, Spain, Russia, Turkey, Netherlands, Poland, Sweden, Belgium, Austria, Ireland Switzerland, Norway, Denmark, Romania, Finland, Czech Republic, Portugal and Greece,
  • North America: United States and Canada
  • Latin America: Brazil, Mexico, Argentina, Columbia, Chile, Ecuador, and Peru
  • Africa: South Africa, Nigeria, Egypt, Algeria, Morocco
CurrencyUS$ (Data can also be provided in local currency)
Supplier Database AvailabilityYes
Customization ScopeOur services can be customized as per the requirements of the customer
Post-Sale Analyst Support360-degree analyst support after service delivery

Request for Real Time Colorants Prices: https://www.procurementresource.com/resource-center/colorants-price-trends/pricerequest

A substance known as a colorant is added to a material in order to modify or alter its surface or color. The colorants are used for a variety of tasks, including painting, printing, and coloring different kinds of materials including plastic and ceramic. Pigments or dyes are both colorants.

By dispersing a pigment in a nonvolatile liquid carrier which can range from simple fatty acid derivatives to mineral oils liquid colorants, further forms colorants. To enhance the outcomes of the dispersion process, surfactants are also added to the liquid. Colorants come in a variety of viscosities, from gel-like to maple syrup.

The United States, the United Kingdom, Germany, Brazil, China, and India are the main countries that produces colorants.

Key Details About the Colorants Price Trend:

Procurement Resource does an in-depth analysis of the price trend to bring forth the monthly, quarterly, half-yearly, and yearly information on the Colorants price trend in its latest pricing dashboard. The detailed assessment deeply explores the facts about the product, price change over the weeks, months, and years, key players, industrial uses, and drivers propelling the market and price trends.

Each price record is linked to an easy-to-use graphing device dated back to 2014, which offers a series of functionalities; customization of price currencies and units and downloading of price information as excel files that can be used offline.

The Colorants price chart, pricing database, and analysis can prove valuable for procurement managers, directors, and decision-makers to build up their strongly backed-up strategic insights to attain progress and profitability in the business.

Industrial Uses Impacting Colorants Price Trend:

Price-Trend-Image

Food items, drinks, printing technologies, textiles, fabrics, pigments, and dyes are just a few of the industrial uses for colorants that have an impact on its pricing trend. Additionally, colorants are used in paint, coating, plastic, and ceramic industries.

Key Players:

• Chr. Hansen A/S
• BASF SE
• Pidilite Industries Limited
• Huntsman International LLC.
• Sensient Technologies Corporation
• Clariant AG
• Lanxess AG

News and Events:

• The chemistry and usage of green colorants for the textile industry had undergone developments and trends in 2021. According to a recent study, by enhancing their extraction technique and using green solvents during the extraction procedures, natural colourants' ecological issues can be lessened. Additionally, the use of eco-friendly and sustainable mordants as well as the structural alteration of natural colourants might lessen their negative effects on the environment.

Related Reports:

About Us:

Procurement Resource offers in-depth research on product pricing and market insights for more than 500 chemicals, commodities, and utilities updated daily, weekly, monthly, and annually. It is a cost-effective, one-stop solution for all your market research requirements, irrespective of which part of the value chain you represent.

We have a team of highly experienced analysts who perform comprehensive research to deliver our clients the newest and most up-to-date market reports, cost models, price analysis, benchmarking, and category insights, which help in streamlining the procurement process for our clientele. Our team track the prices and production costs of a wide variety of goods and commodities, hence, providing you with the latest and consistent data.

To get real-time facts and insights to help our customers, we work with a varied range of procurement teams across industries. At Procurement Resource, we support our clients, with up-to-date and pioneering practices in the industry, to understand procurement methods, supply chain, and industry trends, so that they can build strategies to achieve maximum growth.

Contact Us:

Company Name: Procurement Resource
Contact Person: Jolie Alexa
Email: sales@procurementresource.com
Toll Free Number: USA & Canada - Phone no: +1 307 363 1045 | UK - Phone no: +44 7537 132103 | Asia-Pacific (APAC) - Phone no: +91 1203185500
Address: 30 North Gould Street, Sheridan, WY 82801, USA


Product NameCorn Processing
Region/Countries for which Data is available
  • Asia Pacific: China, India, Indonesia, Pakistan, Bangladesh, Japan, Philippines, Vietnam, Iran, Thailand, South Korea, Iraq, Saudi Arabia, Malaysia, Nepal, Taiwan, Sri Lanka, UAE, Israel, Hongkong, Singapore, Oman, Kuwait, Qatar, Australia, and New Zealand
  • Europe: Germany, France, United Kingdom, Italy, Spain, Russia, Turkey, Netherlands, Poland, Sweden, Belgium, Austria, Ireland Switzerland, Norway, Denmark, Romania, Finland, Czech Republic, Portugal and Greece,
  • North America: United States and Canada
  • Latin America: Brazil, Mexico, Argentina, Columbia, Chile, Ecuador, and Peru
  • Africa: South Africa, Nigeria, Egypt, Algeria, Morocco
CurrencyUS$ (Data can also be provided in local currency)
Supplier Database AvailabilityYes
Customization ScopeOur services can be customized as per the requirements of the customer
Post-Sale Analyst Support360-degree analyst support after service delivery

Request for Real Time Corn Processing Prices: https://www.procurementresource.com/resource-center/corn-processing-price-trends/pricerequest

The components of maize kernels are extracted through the procedure of processing corn to produce an extremely pure product. The majority of the value products made using this method are employed in the food business. The maximum volume of corn is produced globally for processing as compared to any other crop. The main purpose of processing maize are to produce ethanol, animal feed, and human nourishment.

Corn has a wide range of applications in both food and industry. The four primary substances created during the processing of corn are starch, protein, oil, and fibre. The corn is processed via two processes namely dry milling and wet milling.

The top corn processing countries are the United States, China, and Brazil. On the other hand, the top exporting countries are Argentina, Ukraine, Brazil, and the United States.

Key Details About the Corn Processing Price Trend:

Procurement Resource does an in-depth analysis of the price trend to bring forth the monthly, quarterly, half-yearly, and yearly information on the Corn Processing price in its latest pricing dashboard. The detailed assessment deeply explores the facts about the product, price change over the weeks, months, and years, key players, industrial uses, and drivers propelling the market and price trends.

Each price record is linked to an easy-to-use graphing device dated back to 2014, which offers a series of functionalities; customization of price currencies and units and downloading of price information as excel files that can be used offline.

The Corn processing price chart, pricing database, and analysis can prove valuable for procurement managers, directors, and decision-makers to build up their strongly backed-up strategic insights to attain progress and profitability in the business.

Industrial Uses Impacting Corn processing Price Trend:

Price-Trend-Image

Corn processing Price Trend methodology is used to produce ethanol, animal feed, and to provide nutrition to the humans which is further used for various industrial purposes that influence the price trend. These usages are in the production of alkenes and solvents, metallurgical hardening, and heating, cutting, and welding. The products also find its application in flame scarfing and glass industry.

Key Players:

• Archer Daniels Midland Company
• Cargill Inc.
• Ingredion Inc.
• Tate & Lyle Plc
• Roquette Frères

News and Events:

• November 12, 2022: A team of researchers from the University of Illinois intends to investigate underappreciated characteristics of corn roots with assistance from a new USD 1.5 million, four-year funding from the USDA's National Institute for Food and Agriculture.

Related Reports:

About Us:

Procurement Resource offers in-depth research on product pricing and market insights for more than 500 chemicals, commodities, and utilities updated daily, weekly, monthly, and annually. It is a cost-effective, one-stop solution for all your market research requirements, irrespective of which part of the value chain you represent.

We have a team of highly experienced analysts who perform comprehensive research to deliver our clients the newest and most up-to-date market reports, cost models, price analysis, benchmarking, and category insights, which help in streamlining the procurement process for our clientele. Our team track the prices and production costs of a wide variety of goods and commodities, hence, providing you with the latest and consistent data.

To get real-time facts and insights to help our customers, we work with a varied range of procurement teams across industries. At Procurement Resource, we support our clients, with up-to-date and pioneering practices in the industry, to understand procurement methods, supply chain, and industry trends, so that they can build strategies to achieve maximum growth.

Contact Us:

Company Name: Procurement Resource
Contact Person: Jolie Alexa
Email: sales@procurementresource.com
Toll Free Number: USA & Canada - Phone no: +1 307 363 1045 | UK - Phone no: +44 7537 132103 | Asia-Pacific (APAC) - Phone no: +91 1203185500
Address: 30 North Gould Street, Sheridan, WY 82801, USA


Product NameCoffee
Region/Countries for which Data is available
  • Asia Pacific: China, India, Indonesia, Pakistan, Bangladesh, Japan, Philippines, Vietnam, Iran, Thailand, South Korea, Iraq, Saudi Arabia, Malaysia, Nepal, Taiwan, Sri Lanka, UAE, Israel, Hongkong, Singapore, Oman, Kuwait, Qatar, Australia, and New Zealand
  • Europe: Germany, France, United Kingdom, Italy, Spain, Russia, Turkey, Netherlands, Poland, Sweden, Belgium, Austria, Ireland Switzerland, Norway, Denmark, Romania, Finland, Czech Republic, Portugal and Greece,
  • North America: United States and Canada
  • Latin America: Brazil, Mexico, Argentina, Columbia, Chile, Ecuador, and Peru
  • Africa: South Africa, Nigeria, Egypt, Algeria, Morocco
CurrencyUS$ (Data can also be provided in local currency)
Supplier Database AvailabilityYes
Customization ScopeOur services can be customized as per the requirements of the customer
Post-Sale Analyst Support360-degree analyst support after service delivery

Request for Real Time Coffee Prices: https://www.procurementresource.com/resource-center/coffee-price-trends/pricerequest 

Coffee is a popular drink worldwide derived and brewed from roasted coffee beans. The beans are the seeds of Coffea plant species that are bitter, somewhat acidic with a dark colour and cause a stimulating effect in humans due to the rich alkaloid and caffeine content. Coffee is grown in more than seventy nations, specifically in the equatorial regions of the Americas, the Indian subcontinent, Africa, and Southeast Asia. It is a very profitable global commodity.

The leading countries producing coffee worldwide are Brazil, Switzerland, Germany, Colombia, and Vietnam.

Key Details About the Coffee Price Trend:

Procurement Resource does an in-depth analysis of the price trend to bring forth the monthly, quarterly, half-yearly, and yearly information on the Coffee price, steel price, eggs price in its latest pricing dashboard. The detailed assessment deeply explores the facts about the product, price change over the weeks, months, and years, key players, industrial uses, and drivers propelling the market and price trends.

Each price record is linked to an easy-to-use graphing device dated back to 2014, which offers a series of functionalities; customization of price currencies and units and downloading of price information as excel files that can be used offline.

The Coffee price chart, pricing database, and analysis can prove valuable for the procurement managers, directors, and decision-makers to build up their strongly backed up strategic insights to attain progress and profitability in the business.

Industrial Uses Impacting Coffee Price Trend:

Price Trend Image

Industrial uses impacting Coffee price trend primarily include the uses of coffee residues. The residue coffee pulp is a waste by-product with significant application in flora, fauna, water, and soil to eliminate the smell and insect proliferation. The pulp is used as an organic fertilizer to enhance fertilizers quality, as a food source for microorganisms and worms, and as feed for animals like chickens, sheep, goats, fish and others. And as a beverage for human consumption.

Key Market Players:

  • Starbucks Coffee Company
  • Nestlé SA
  • Unilever
  • Chameleon Cold-Brew
  • Kohana Coffee
  • High Brew Coffee

News and Events:

  • May 21, 2022 - Non-coffee producing nations have seen a recovery in coffee demand during quarter one; however, there are indications of a likely slowdown in Russia and China demand in the approaching quarters.

Related Reports:

About Us:

Procurement Resource offers in-depth research on product pricing and market insights for more than 500 chemicals, commodities, and utilities updated daily, weekly, monthly, and annually. It is a cost-effective, one-stop solution for all your market research requirements, irrespective of which part of the value chain you represent.

We have a team of highly experienced analysts who perform comprehensive research to deliver our clients the newest and up-to-date market reports, cost models, price analysis, benchmarking, and category insights, which help in streamlining the procurement process for our clientele. Our team track the prices and production costs of a wide variety of goods and commodities, hence, providing you with the latest and consistent data.

To get real-time facts and insights to help our customers, we work with a varied range of procurement teams across industries. At Procurement Resource, we support our clients, with up-to-date and pioneering practices in the industry, to understand procurement methods, supply chain, and industry trends, so that they can build strategies to achieve maximum growth.

Contact Us:

Company Name: Procurement Resource
Contact Person: Jolie Alexa
Email: sales@procurementresource.com
Toll Free Number: USA & Canada: +1-415-325-5166 | Europe & Africa: +44-702-402-5790 | APAC: +91-8586081494
Address: 30 North Gould Street, Sheridan, WY 82801, USA

Wednesday, November 16, 2022

 The latest report titledCopper II Sulphate Production Cost Report by Procurement Resource, a global procurement research and consulting firm, provides an in-depth cost analysis of the production process of Copper II Sulphate.

Report FeaturesDetails
Product NameCopper II Sulphate
Process IncludedCopper II Sulphate Production From Copper Oxide
Copper II Sulphate Production From Copper Ore
Copper II Sulphate Production From Copper
Segments Covered
  • Manufacturing Process: Process Flow, Material Flow, Material Balance
  • Raw Material and Product/s Specifications: Raw Material Consumption, Product and Co-Product Generation, Capital Investment
  • Land and Site Cost: Offsites/Civil Works, Equipment Cost, Auxiliary Equipment Cost, Contingency, Engineering and Consulting Charges, Working Capital
  • Variable Cost: Raw Material, Utilities
  • Fixed Cost: Labor Requirement & Wages, Overhead Expenses, Maintenance Charges
  • Financing Costs: Interest on Working Capital, Interest on Loans
  • Depreciation Charges
  • General Sales and Admin Costs
  • Production Cost Summary
CurrencyUS$ (Data can also be provided in local currency)
Pricing and purchase optionsBasic: US$ 1499
Premium: US$ 2999
Enterprise: US$ 4799
Customization ScopeThe report can be customized as per the requirements of the customer
Post-Sale Analyst Support360-degree analyst support after report delivery

Procurement Resource study is based on the latest prices and other economic data available. It also offers additional analysis of the report with detailed breakdown of all cost components (capital investment details, production cost details, economics for another plant location, dynamic cost model). In addition, the report incorporates the manufacturing process with detailed process and material flow, capital investment, operating costs along with financial expenses and depreciation charges.

Procurement Resource’s detailed report describes the stepwise consumption of material and utilities along with a detailed process flow diagram. Furthermore, the study assesses the latest developments within the industry that might influence Copper II Sulphate production cost, looking into capacity expansions, plant turnarounds, mergers, acquisitions, and investments.

Procurement Resource Assessment of Copper II Sulphate Production Process:

1. Copper II Sulphate Production From Copper Oxide: This study presents a detailed cost analysis of Copper II Sulphate production from copper oxide. In this process, copper oxide is made to react with dilute sulfuric acid through slowly heating it with the acid.

Request Free Sample - https://www.procurementresource.com/cost-analysis/copper-ii-sulfate-production-from-copper-oxides/requestsample

2. Copper II Sulphate Production From Copper Ore: This study provides a detailed cost analysis of Copper II Sulphate production from copper ore. In this process, copper ore (low-grade) is gradually leached in air to form copper sulfate while using bacteria as a biocatalyst (optional).

Request Free Sample - https://www.procurementresource.com/cost-analysis/copper-ii-sulfate-production-from-copper-ore/requestsample

3. Copper II Sulphate Production From Copper: This report provides a detailed cost analysis of Copper II Sulphate production from copper. In this process, copper metal is treated with sulfuric acid (concentrated) to form copper sulfate.

Request Free Sample - https://www.procurementresource.com/cost-analysis/copper-ii-sulfate-production-from-copper/requestsample

Product Definition:

Copper II Sulphate is an inorganic salt and has a molecular formula of CuSO4. It is also called blue vitriol and is formed from the reaction of cupric oxide and sulfuric acid. Copper stays in the oxidation state of +2 in Copper II Sulphate.

It is readily soluble in water- highly soluble in hot water and soluble in cold water. It occurs in crystalline form with white/off-white/greenish white color in amorphous form. However, forms bright blue crystals when is in hydrated dorm with five molecules of water forming CuSO4.5H2O.
It is used for many industrial purposes and is heavily used in agriculture industry as well owing to its properties.

Market Drivers:

Copper II Sulphate is a sought-after inorganic molecule widely used across industries. Its primary market driver is its usage in agriculture industries. Its use as a key ingredient in various pesticides, fungicide, additives for soil and feed, and germicide, etc. gets it to have a firm hold over the agriculture industry. Moreover, it is used as a chemical reagent for various chemical reactions.

Key Questions Answered in the Copper II Sulphate Production Cost Report:

• What are the key drivers propelling the Copper II Sulphate market?
• What are the various processes used for Copper II Sulphate production?
• What are the raw materials required to produce Copper II Sulphate?
• What are the different operations units involved in the production of Copper II Sulphate?
• What are the manpower and utility requirements in the production process of Copper II Sulphate?
• What are the various costs engaged in the production of Copper II Sulphate?
• What are the construction costs involved in setting up a Copper II Sulphate production facility?
• What are the working capital requirements?
• What is the process of raw material procurement for Copper II Sulphate production?
• What is the time frame for Copper II Sulphate plant start-up?
• What is the pricing mechanism of Copper II Sulphate?

Browse More Production Cost Reports:

About Us:

Procurement Resource ensures that our clients remain at the vanguard of their industries by providing actionable procurement intelligence with the help of our expert analysts, researchers, and domain experts. Our team of highly seasoned analysts undertakes extensive research to provide our customers with the latest and up-to-date market reports, cost models, price analysis, benchmarking, and category insights, which aid in simplifying the procurement process for our clientele.

Procurement Resource work with a diverse range of procurement teams across industries to get real-time data and insights that can be effectively implemented by our customers. As a team of experts, we also track the prices and production costs of an extensive range of goods and commodities, thus, providing you with updated and reliable data.

We, at Procurement Resource, with the help of the latest and cutting-edge techniques in the industry, help our clients understand the supply chain, procurement, and industry climate so that they can form strategies that ensure their optimum growth.

Contact Us:

Company Name: Procurement Resource
Contact Person: Jolie Alexa
Email: sales@procurementresource.com
Toll Free Number: USA & Canada - Phone no: +1 307 363 1045 | UK - Phone no: +44 7537 132103 | Asia-Pacific (APAC) - Phone no: +91 1203185500
Address: 30 North Gould Street, Sheridan, WY 82801, USA

Popular Posts

Blog Archive